May 13, 2015
Fascinating Contour Lines and How They Work
Every stockpile measured by our customers generates a Stockpile Report with the stockpile’s photo and measurement video.
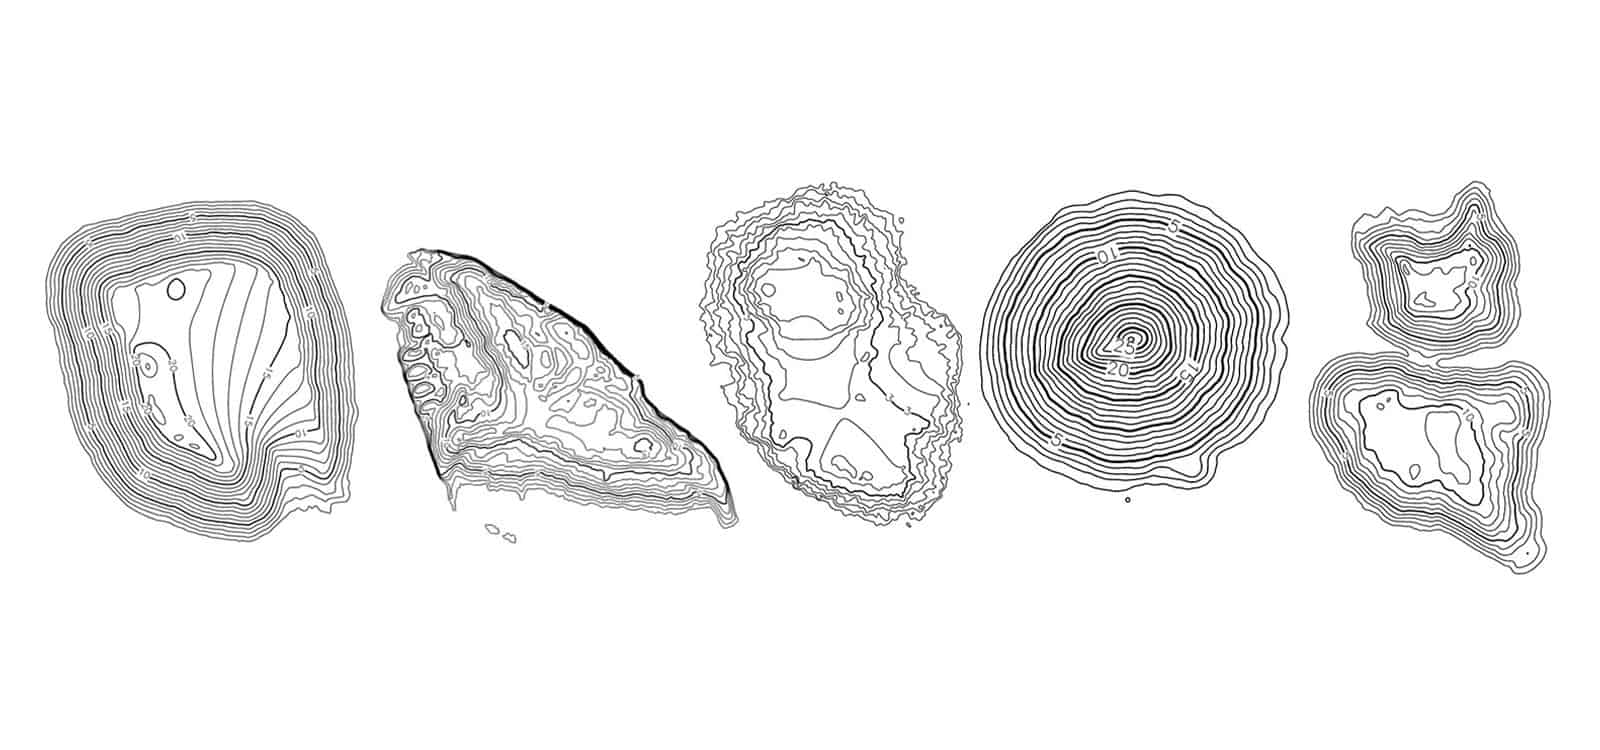
Our stockpile reports also feature a black and white topographical map of the pile, rendered using contour lines.
Stockpile Reports has customers located all over the world. Our team views color images from stockpiles that have been measured from exotic locations such as Australia, India, South America, Chile, New Zealand and more. It is wonderful to view sunny stockpile images with blue skies, especially when the weather is dreary here in the Pacific Northwest.
We enjoy viewing the black and white contour lines that are generated from each pile measured just as much as the color images. Every contour map is unique! Some are jagged, others are almost perfectly symmetrical. Some of the contour maps look like outlines of animals such as fish, or butterflies.
Contour lines are lines drawn on a map connecting points of equal elevation. Contour lines show both the elevation and illustrate the shape of the terrain.
Topographic Maps
A contour map is another name for a topographic map, illustrated from contour lines.
A topographic map is a two-dimensional representation of a portion of the three-dimensional surface of the earth. Many of you who hike outside are familiar with this type of map. Topographic maps show contour lines for only certain elevations. These lines are evenly spaced apart. This spacing is called the contour interval.
To make topographic maps easier to read, every fifth contour line is an index contour. The index contour lines are the only ones labeled. The index contours are a darker or wider line in comparison to the regular contour lines. Elevations are marked on the index contour lines only. To determine the gradient of elevations, observe the amount of space in between the lines. If the contours are placed close together, then you’re looking at a steep slope. If the contours have wide spaces in between — or aren’t there at all — then the terrain is relatively flat.
Some industries that use topographic maps extensively are: engineering, exploration, construction, natural resource management, recreation, and public works.
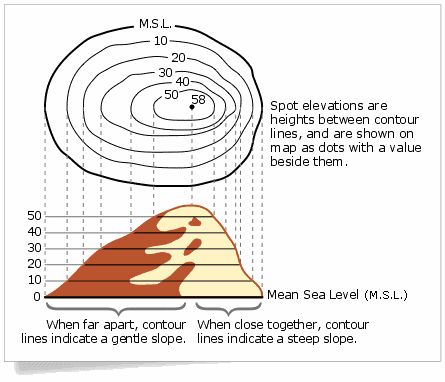
Contour map illustration from Natural Resources Canada.
Understanding Your Stockpile Report
When viewing a Stockpile Report, it is easy to see how steep the stockpile is, view the edges, and the height from looking at the stockpile’s contour map.
Collecting regular measurements enables remote site management and site accountability. With each report, remote managers can visually inspect the quality and state of each pile via the stockpile image and contour map, to ensure proper stockpile management.
Contact us today for more information about our subscription-based service and our reports.
Stay In the Know
Be the first to know about the latest Stockpile Reports news and features.