August 20, 2014
View and Share Measurements with Reports

Stockpile Reports provides our customers with two primary reports: the Stockpile Report and a Site Report.
In addition to these, customers can get a Historical Report and also choose to receive monthly Usage Notifications.
The Stockpile Report
A Stockpile Report contains both categorical and calculated data– most importantly, tonnage and volume (cubic yards). It includes the name, material type, the data result, an image of the stockpile and a topographical map with contour lines. Every stockpile that is measured by either iPhone, GPS, Walking Wheel, Aerial or Laser receives this type of report. It is available to view online and via a PDF that we generate. Click to view a large Sample Stockpile Report.
Benefits of Having a Stockpile Report:
- Automatically Creates an Audit Trail: Each stockpile has a visual record and time-stamped report generated.
- Documentation: Provides materials inventory to banks to support financing
- Remote Management and Site Accountability: With each report, remote managers can visually inspect the quality and state of each stockpile via the video and by the report’s image to ensure proper site management.
- Inventory: Evaluate a stockpile’s tonnage from month to month, or weekly with on-line reporting.
- File, Share and Save: No need for each viewer to have account access. Share and file the data results with our PDF documents or keep it offline for access.
The Site Report
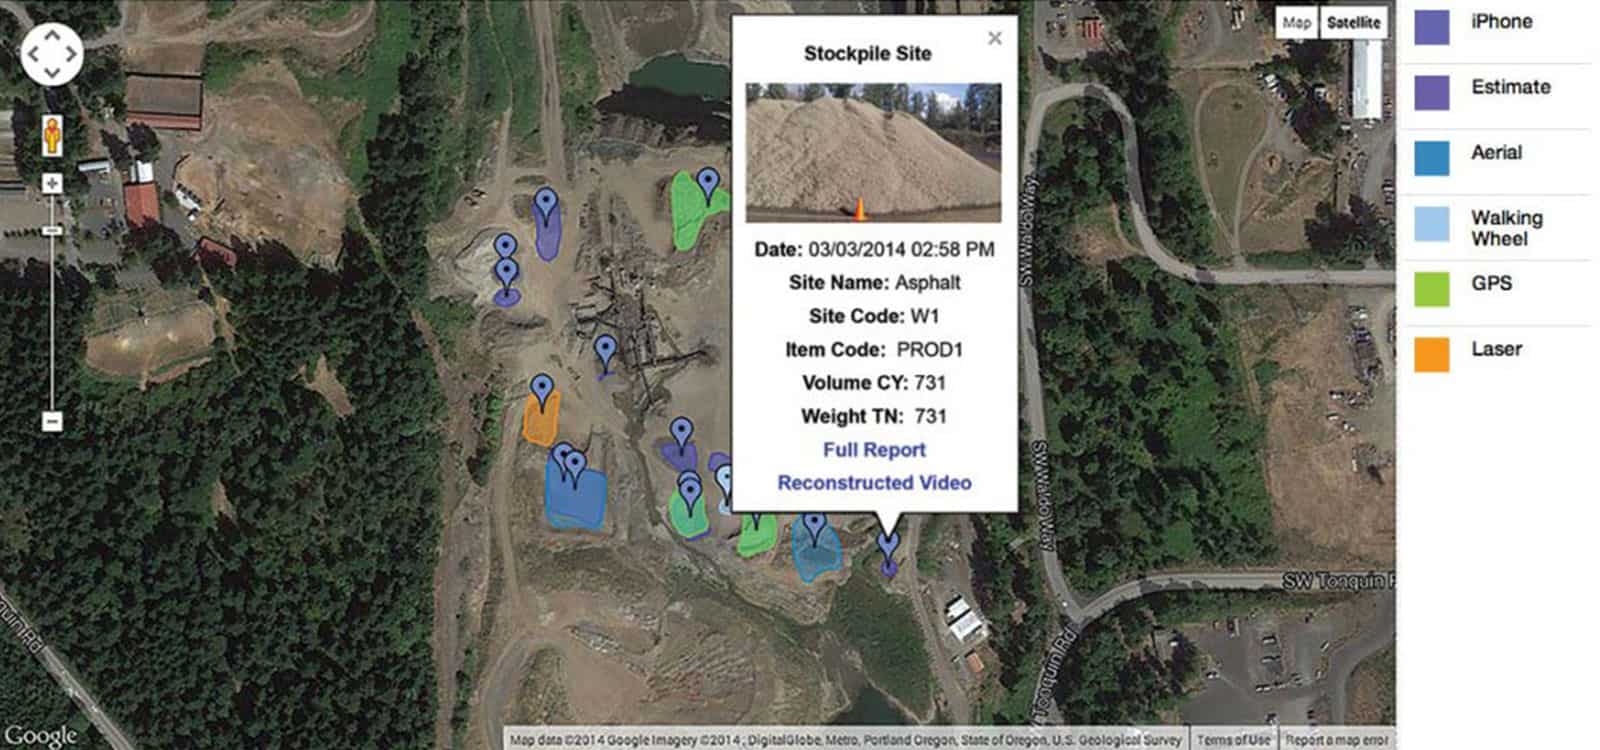
A Site Report aggregates all the Stockpile Reports for a site and overlays them on a Google Maps view. Customers have multiple viewing options. They can select an individual site– or all sites at once– and see the most recent measurements or go back in time entering a custom date range. Each measurement is color-coded to correspond with a different type of measurement method, as shown via the color key. For example, the purple-shaded areas represent stockpile data collected using an iPhone. Other collection methods include GPS, Aerial, Walking Wheel and Laser. Users may also estimate a stockpile size if access is difficult to reach or obstructed. Single-clicking on each marked stockpile reveals information about the pile including: the pile name, material, tonnage, volume and a video snippet. Zoom in for a closer view of a single stockpile or zoom out for a broader world-wide view.
Site Report Benefits:
- Planning: Use a site report to help plan where to place or move a stockpile.
- Cycle Observation: View how each measured stockpile has changed shape and placement onsite, by week or month by calendar range.
- Multiple Site View: Larger companies with multiple sites can review operations globally, as each site using Stockpile Reports is represented on a Google Map or drill-down into a single site for review.
Historical Reports
Share a historical perspective of every stockpile’s growth and shrinkage with your team. Review tonnage changes yearly and by month. Our Historical Reports illustrate changes of every measured stockpile each time new data is uploaded. The stockpile outline is overlaid on a Google Map with a bar chart illustrating the tonnage variations. Use the slider feature to dynamically view changes of the shape and position of each mapped stockpile over time. Click on the Pile History’s bar chart for exact tonnage measurements.
Usage Notifications
This is an option for clients who wish to receive regular monthly updates on their individual usage and tonnage they have personally measured. The report shows percentages of measurement types, cumulative tonnage amounts, and rewards frequent users with badges. Customers can view this report online in their Profiles tab or choose to have it emailed to them once a month.
Try the Stockpile Reports service for yourself and receive your own customized reports. Simply contact us to get set up in our system by filling out the online form.Your company may even qualify for a limited No- Cost trial.
Stay In the Know
Be the first to know about the latest Stockpile Reports news and features.