April 9, 2014
How Winter Weather Affected Q1 Stockpile Measurements
Stockpile Reports reviewed our stockpile data for the Winter months in 2014 to see how our customer usage varied from week to week.
We strongly suspected that the unusually cold weather during Q1 affected measurements, and our data proved that to be true. Take a look at the results we have for aggregates stockpile measurements by our clients in the US, and how usage correlates to weekly average temperatures published via the National Climatic Data Center at NOAA.
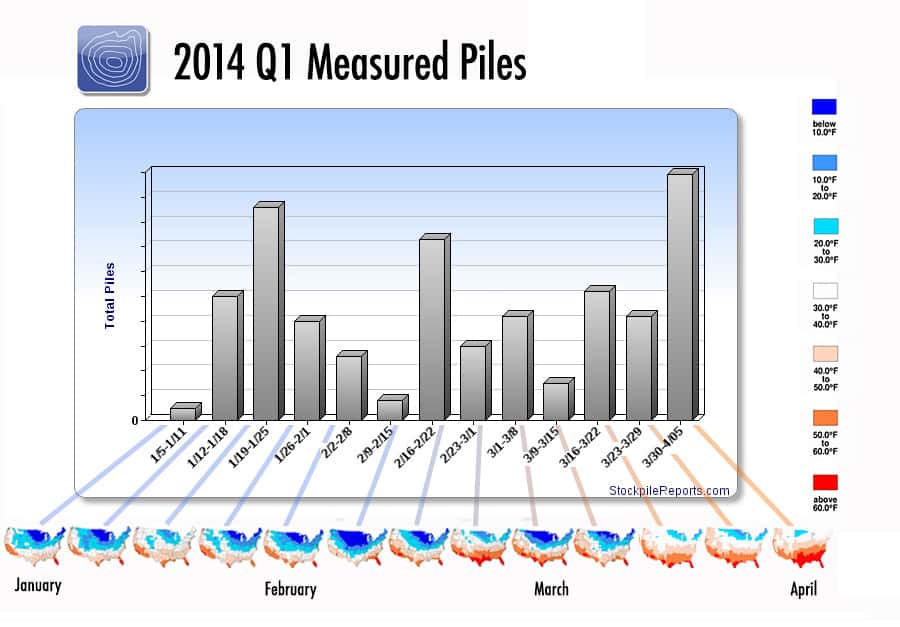
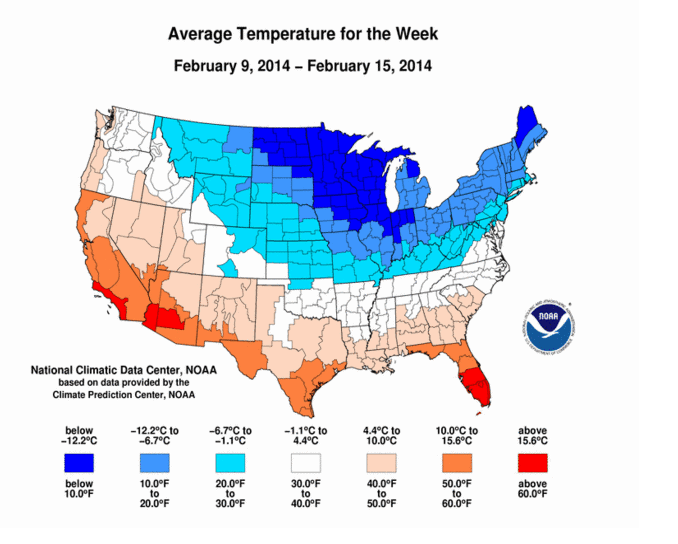
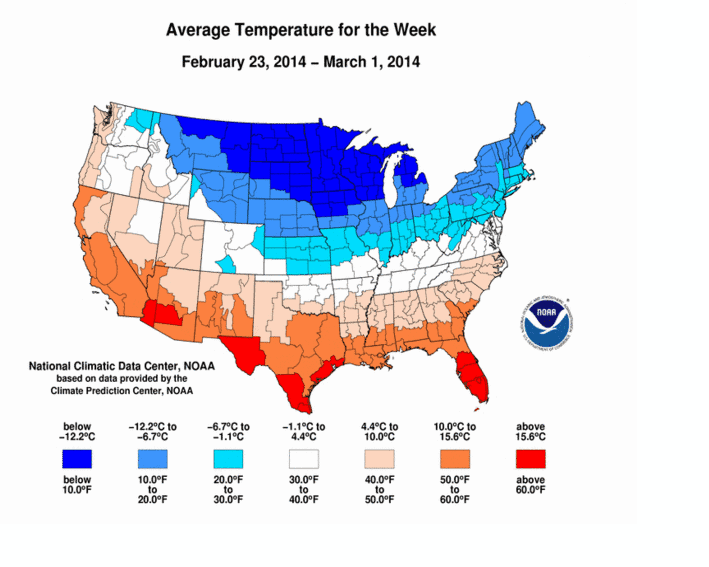
The Q1 timeline (above) shows that over half of the country experienced freezing temperatures from 30 degrees and below through early March. Stockpile measurements rebounded on warmer weeks. Happily, the weather warmed at the end of March, just in time for the end of Q1.
Below are details for the weeks that our customers had the lowest amounts of measured piles: January 5-11, early February and early March.
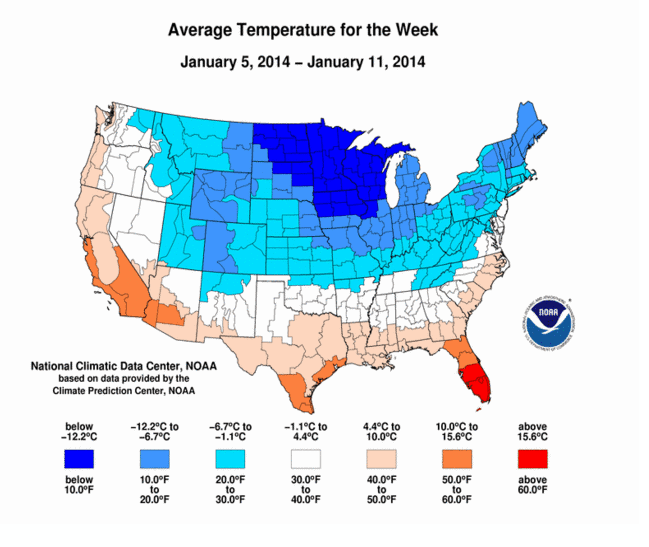
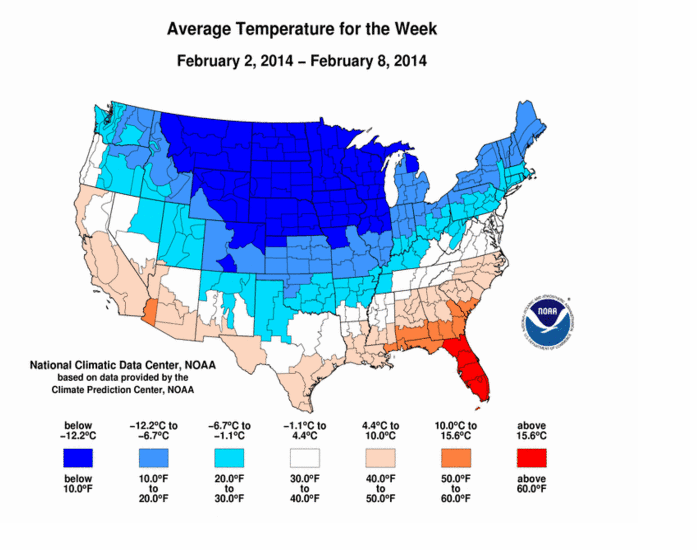
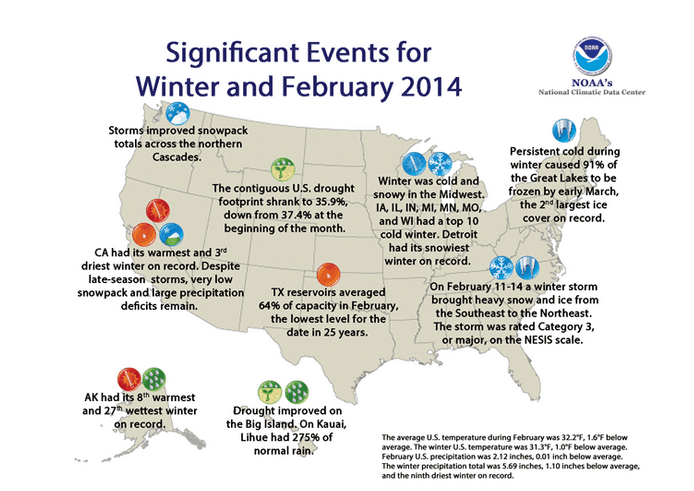
Lastly, here is an overview of the extreme weather that affected business everywhere. The average US temperature for February was 32.2 degrees, and for Winter overall it was 31.3 degrees.
Now that the weather has warmed and it is Q2, it is time to go outside and measure your piles if you have not already done so. If you are a Quarry Manager, an Aggregates Manager, a Construction Sales Managers or a CFO and want information about the Stockpile Reports system please connect with us.
Stay In the Know
Be the first to know about the latest Stockpile Reports news and features.