This article explains how to access, read, and verify your stockpile measurement reports. You’ll learn where to find your reports, how to navigate report details, and how to use both automatic and manual verification tools.
The Dashboard #
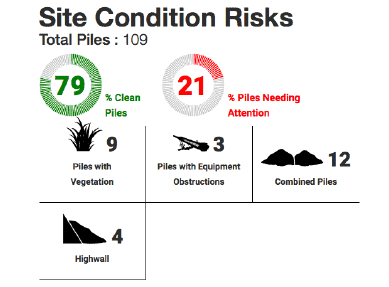
Site Condition Risks #
The total number of piles that you currently manage, the percentage of those piles that are ideal for measurement, and how many have an environmental risk that has the potential to affect the results. Below the percentages, a sum of piles and their specific environmental issues. In the example below, nine piles have vegetation obscuring the toe or surface of the pile, three piles have equipment obstructions, twelve piles are combined without separation on a large portion of their sides Four piles are against highwalls with an ambiguous base floor.
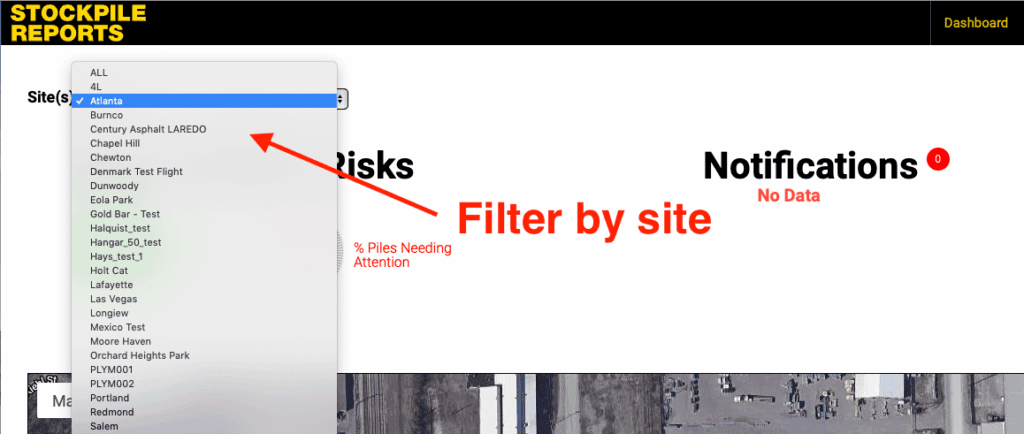
Selecting individual sites from the Site(s) drop down at the top of the home page will update Site Condition Risks to reflect only risks at the selected site.
The Map Viewer #
The map on the Dashboard displays the most recent measurement of each pile in your inventory. Each subsequent measurement will replace the current measurement on the map. The default map shows all piles across the whole company. Select the target site from the Site(s) drop down to filter the map view to a specific site:
Clicking on the blue pins brings up a basic informational box about the pile including a photo of the pile, the Product Name, Date of Measurement, Site Code, Site Name, Volume, Tonnage, and Verification Status.
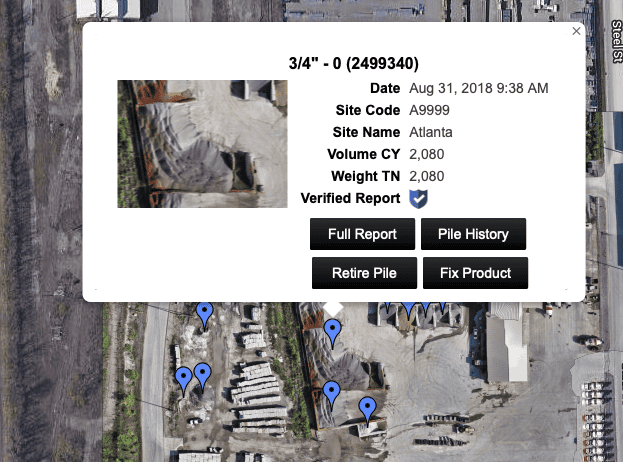
The Full Report links to the detailed measurement report. Piles measured twice or more have a Pile History button. Users can retire a pile using the Retire Pile button. Account administrators can update the product info using the Fix Product button in the quick view pop-up.
Click the “X” at the top right of the informational box to close it.
View and Download Measurements by Product #
Measurements are listed below the map viewer in a tabular format which makes it easy to see your complete inventory by category. Buttons for viewing by Product type, individual Pile, or individual Measurement are located above the list of measurements. In this section we will walk you through how to view your inventory by product type and how to download the measurement data. The advantage to viewing your measurements by product type is that we calculate the total of volume each product. In the case you have multiple piles of the same product, the displayed volume and tonnage is the sum totals of the individual piles.
- Choose the site at which your piles are located using the Site(s) dropdown
- Push the Products button to view your inventory by products
- The total number of products at the site is displayed on top of the list
- Click column headers to sort the measurement data by the column type
- Click the Actions dropdown and choose View Piles for this Product and the pile pins will turn green on the map viewer (see below)
- Click the Download .XLS button to download the measurement data as an excel file in a product view format
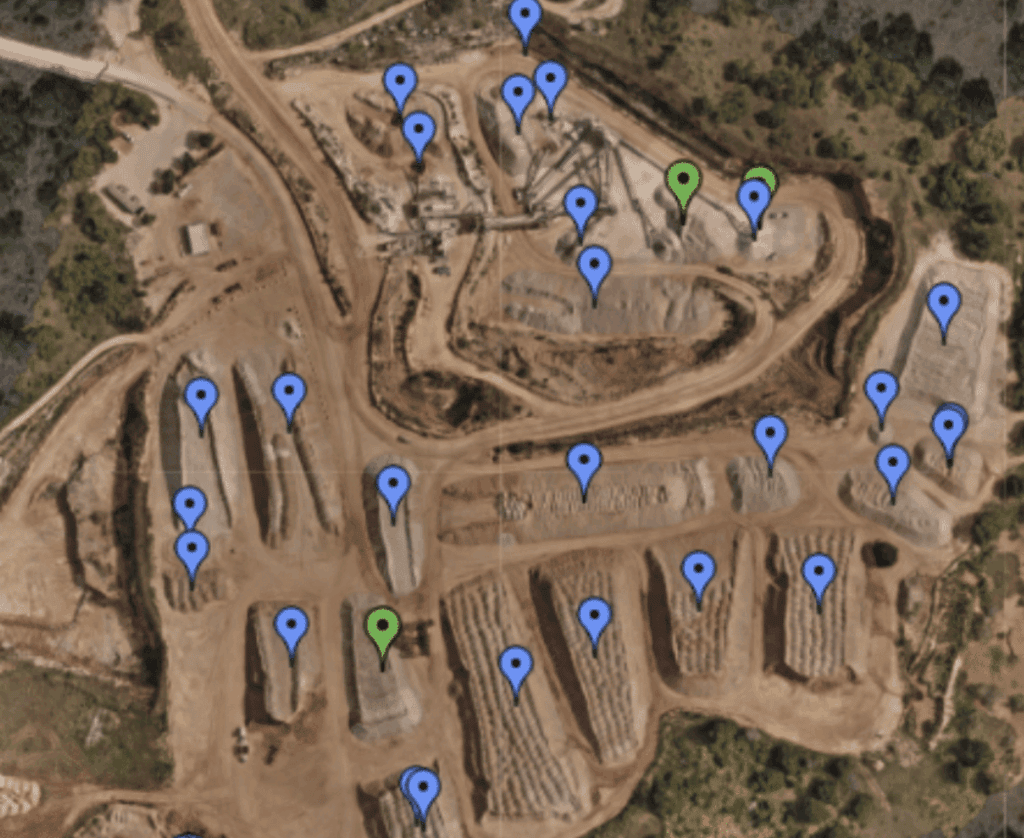
Green pins are piles highlighted by Product.
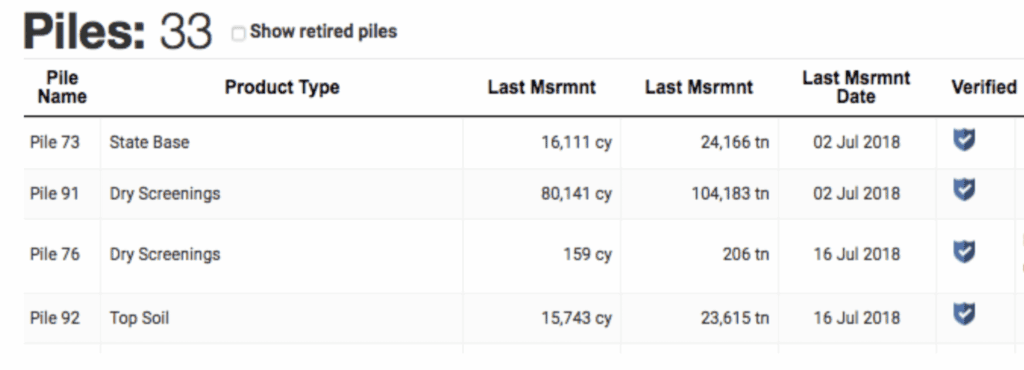
View and Download Measurements by Piles #
As opposed to Product view, Piles view breaks out each individual pile on the site with a trackable pile number. Pile view will always display the volume and tonnage of the last measurement of the pile ensuring you are using the most up to date information for inventory.
- Choose the site at which your piles are located using the Site(s) dropdown
- Push the Piles button to view your inventory by individual piles
- The total number of piles at the site is displayed on top of the list (Check the “Include Retired Piles” box if you would like to view historical piles)
- Click column headers to sort the measurement data by the column type
- Click the Actions dropdown to access the following options:
- Retire Pile – This removes a pile that is no longer located at the site
- Request Inquiry – Opens the pile measurement inquiry dialog
- Change Pile Name – Allows you to give the pile a custom name
- Click the Download .XLS button to download the measurement data as an excel file in a pile view format
A pile number is assigned automatically to each new pile on site.
View and Download by Individual Measurement View #
As opposed to Pile and Products view, Measurements view allows you to query all measurements by a specific time frame.
- Choose the site at which your piles are located using the Site(s) dropdown.
- Push the Measurements button to view your inventory by individual measurements.
- Choose the time frame of measurements to display from the Date Range dropdown.
- The top of the list displays the total measurements that were performed within the specified date range.
- Click column headers to sort the measurement data by the column type.
- Click the Actions dropdown to access the following options:
- View Pile on the Map – Changes the pile’s pin from blue to red on the map
- Edit Measurement Details – Access controls to change the product type, add notes, and update the conversion factor (Admin Only Tool).
- Move Pile – in the rare occasion the GPS position from an iPhone based measurement is inaccurate, the measurement can be displaced from the actual pile location. The move pile function allows you to change the location of the pile on a map (Admin Only Tool)
- Click the Download .XLS button to download the measurement data as an excel file in an individual measurement view format.
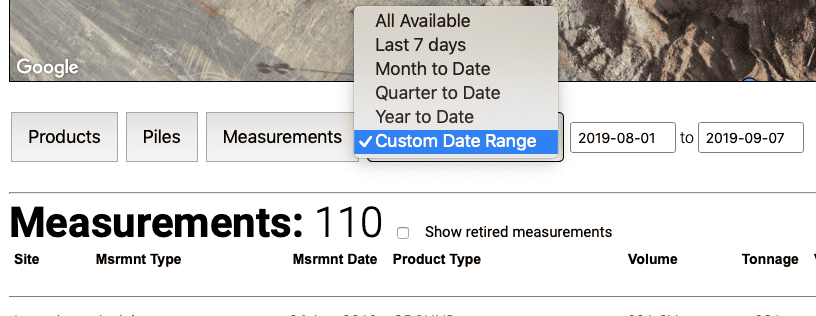
Choosing Custom Date Range Open a Calendar From.
Detailed Report View #
The detailed report view is an in-depth informational view of a single stockpile measurement. Information provided in the detailed view includes site, product, volume and tonnage data which can also be found in the tabular view on the home page. A more comprehensive breakdown of the pile’s verification score is provided as well as pile contours and an interactive 3D viewer of the measurement. In the following portion of this guide, we will break down each section of the detailed measurement report.
Overview #
The detailed measurement report can be broken down into 4 main sections: detailed stat, confidence score, measurement photo/video replay, and the pile viewer. We will break down each section individually.
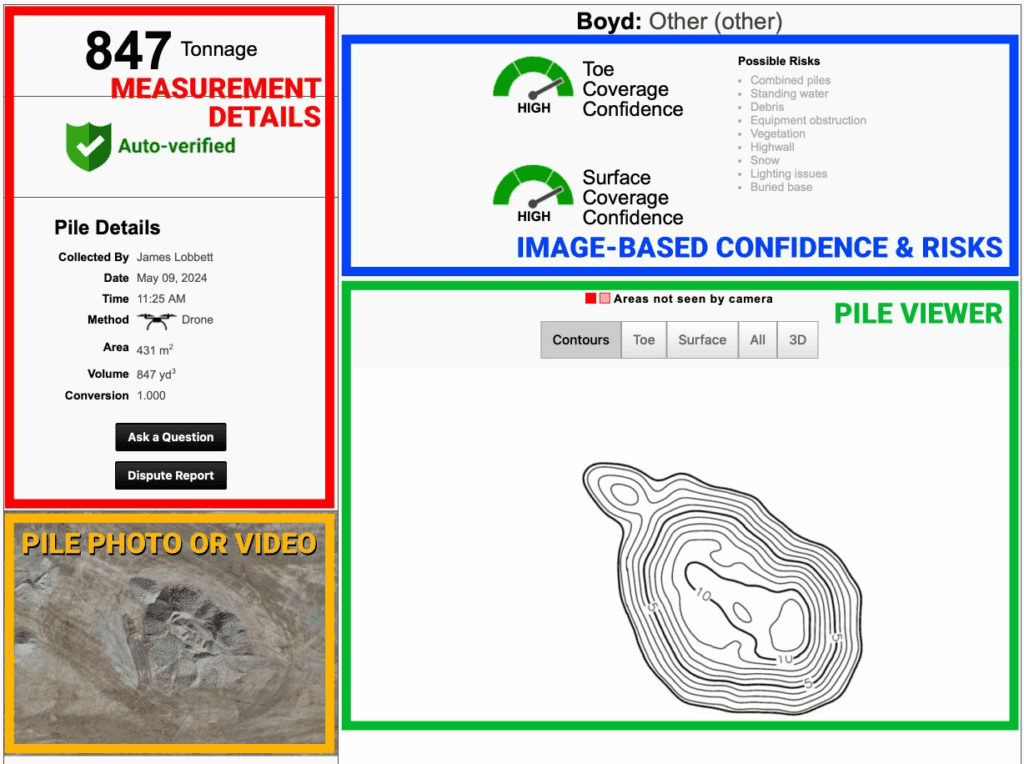
Detailed Stats #
The top left of the detailed measurement report contains a majority of the measurement stats. Below we break down each line of the stats section with a brief description:
- Tonnage/Yards: the tonnage of the pile generated by multiplying the volume by the provided conversion factor. If your company’s default value is set to yards, then yards will display instead of tons.
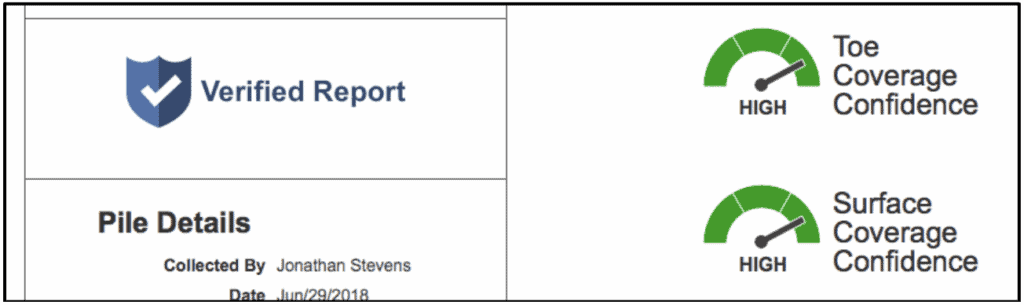
- Verification Status
- Measurements with a high toe AND high surface confidence score will receive an automatic Verified Report badge. This score is based on the images we receive and the conditions of the pile in those images. Piles that are managed well (little-to-no risks such as standing water, combined piles, vegetation, obstructions, etc.) will have images that yield higher quality results.
- Measurements with a toe OR surface confidence level of medium or low will not receive a Verified Report badge and will need to be manually verified by the user Click the Manually Verify button to accept or reject the measurement. This score is based on the images we receive and the conditions of the pile in those images. Piles that are NOT managed well (risks such as standing water, combined piles, vegetation, obstructions, etc.) will have images that yield lower quality results. On occasion risks can be high enough that is will cause measurement failures for a pile(s).
- Collected By: the user who performed the measurement either with the SR Measure iPhone app or a drone.
- Date: the date the measurement was performed.
- Time: the time this measurement was performed. This will be the timestamp from the start of the measurement video or the first photo captured with the drone.
- Duration: the time it took to complete the measurement. This is only for piles measured with the SR Measure iPhone app.
- Method: the method used to measure the pile.
- Cubic Yards/Meters: the volume of the measurement in yard for the US or meters for international users.
- Conversion: the conversion rate in tons per cubic yard or tons per cubic meter
- Ask a Question: Need some help? Let us know here.
- Dispute Report: don’t feel your measurement was correct or doesn’t align with what you expect to be on the ground? This button will bring up a dispute form. Let us know why you believe the measurement is incorrect. As much detail as possible here will help us investigate thoroughly. All disputes are tracked with a unique tracking number and all communication is saved for audit purposes. Inquiries are investigated in 24-48 hours.
Confidence Scoring #
Each pile receives a surface and toe score (bunker measurements only receive a surface score). We rank each with High, Medium, or Low surface and toe scores. A pile where a majority of the surface and toe are visible to the measurement device will receive both a high surface and toe score. A Verified Report stamp will be placed on the report which means the measurement has a minimal risk of being inconsistent.
Piles where a large section of the toe or surface is obstructed from the measurement device will receive a medium or low confidence score. Possible risks will be highlighted indicating reasons for the low score. (i.e. Vegetation obstructions or snow).

Reports with low scores are not necessarily bad measurements. We suggest the user
reviews the contours, 3D model, and volume to ensure the final result makes sense.
Click the Manually Verify button, add an approval or rejection note, and Approve or Reject the measurement. We suggest following our recommended guidelines linked in the manual verification direction dialog.

Measurement Photo/Video Replay #
The bottom left section of the detailed report displays photographic information from the measurement. Aerial based measurements display a top down view of the pile. Clicking on the photo will enlarge it to a full screen view. Measurements taken with an iPhone will display a playable video. This video has been enhanced to show every fourth frame from the video which speeds up playback.

iPhone Measurement replay Aerial based measurement photo
Pile Viewer #
The bottom right section of the detailed report displays topographic information about
the pile. The pile viewer’s default view is a 1 contour map of the pile, however, selecting different view options displays various thematic data. Listed below are your options for viewing the pile:
- Contour: this is the default 2D contour map of the pile. 1 foot contours are displayed for US users and half meter contours for international users. These are the contours that display on the printable map report

- Toe: the red lines highlight areas of the pile where the toe was not seen by the measurement device

- Surface: the surface view highlights, with a red crosshatch, the areas of the pile where the surface was not seen by the measurement device

- All: the All view highlights both the surface and toe risks in one map

- 3d: the 3d viewer allows you to view the measurement with an interactive 3d viewer. Toe and surface scores are highlighted on the 3d model.

Aerial Measurement View #
Users who measure stockpiles using a drone or via Stockpile Report’s 3rd party flight service can query measurements by individual flights. The following functionality can be accessed through the Aerials tab on the top navigational bar on the website.
Query Measurement by Aerial #
In order to view your aerial measurements by flight, you will first need to query the data by searching through data ranges. To do so, follow these steps:
- Click on the Aerials tab
- Select the site from the Sites list
- Specify the date range to include the date of the flight you would like to view

You can view the measurements for each separate aerial by clicking View. A report page will appear with the sitewide image from the site and pile pins/outlines overlaid on the image. Below the map will display measurement information:

At the top of the map is a button to Export Data to Excel which will export a CSV file of the tabular measurement data. Also, you have an option to download the individual reports by clicking the Individual Report PDF’s button. The individual reports will be collated into a single PDF document.